SPEAKER DIRECTIVITY / OFF AXIS RESPONSE: THEORY AND MEASUREMENT TECHNIQUES
DECEMBER 7, 2013 – by Nyal Mellor – Acoustic Frontiers ©
–
This blog article is the first in a mini-series about speaker directivity or off axis frequency response. For us the two most important things in determining sound quality in a home theater or stereo are the speaker and the room. Above the room’s transition frequency the speaker’s directivity dominates what we hear and so it is an important topic to understand.
Any acoustic treatment scheme for early reflection and reverberation control should be designed from the speaker out, by considering it’s directivity and how it interacts with the room surfaces. Acoustic treatment can be used to shape and control the speaker’s off axis response and therefore how it interfaces to the room. For best sound quality the acoustic treatment design should not follow a cut-and-dried approach of generically installing absorbers at reflection points. It is consideration of the speaker’s radiation pattern that separates the men from the boys in terms of those providing acoustic treatment expertise to home theater and audio enthusiasts as well as project studio owners.
This article looks at the theory behind speaker directivity and ways to measure it. Later articles will discuss speaker off axis response in terms of it’s importance in room acoustics and psychoacoustics. We will also look at speakers with good and bad off axis performance and discuss their implications for room acoustic treatment.
Speaker directivity
Directivity is the term used to describe the way a speaker’s frequency response changes at off axis angles. A wide directivity speaker is typically thought of as one that maintains amplitude (sound pressure level, SPL) consistency between the on and off axis sound. A narrow directivity speaker is one where the on and off axis amplitudes are substantially different.
For purposes of discussion let’s imagine a perfect point source radiator. As long as the source remains small with respect to wavelength the radiation will be omnidirectional, with no change in the frequency response at off axis angles. When the wavelength starts to become small relative to the source the radiation begins to “beam” directly ahead and off axis we start to see lobing in the frequency response at off axis angles. This lobing is caused by phase cancellation as sounds from different parts of the piston (for example near side and far side) arrive out of phase with each other.
Polar plots
Off axis cancellation effects are often illustrated through polar response graphs which show the dB level at various angles from 0 to 90 degrees. In the diagram the dimensionless number ka refers to circumference* divided by wavelength. *circumference can be easily calculated as pi or 3.141 multiplied by the diameter.
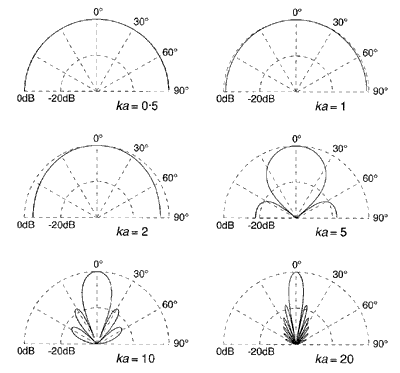 For example a 15″ piston has a circumference of around 4ft, so ka is around 250Hz. Above ka = 1 the piston starts to become directional. Relatively smooth off axis response is maintained to ka = 2 (500Hz for the 15″ piston) but by ka = 5 (1250Hz for the 15″) the piston is beaming with notable response lobing. A 15″ single driver speaker would be a narrow directivity speaker whereas a 2″ single driver speaker would be considered relatively wide directivity.
Anechoic vs windowed FFT measurements
The only accurate way to truly assess a speaker’s frequency response is to use a large anechoic chamber. The cost and size of these mean that very few have access to them, including the majority of loudspeaker manufacturers! To measure the loudspeaker’s response at a point in space a microphone is placed at a suitable distance. Ideally the microphone is far enough away from the loudspeaker so that it is in the acoustic ‘farfield’, which may not begin until 6ft for a large speaker. An impulse response is then taken by playing a stimulus signal, such as a swept 20Hz-20kHz sine wave, from the loudspeaker and capturing the response at the microphone using computer software. For measurements not taken in an anechoic chamber the impulse response is ‘windowed’ to eliminate reflections from room boundaries. The length of time between the direct sound and the window dictates both the lowest frequency to which data can be measured and the resolution of the measurement. The use of an impulse response window is called a ‘quasi-anechoic’ technique, and it’s limitations are described in this Sound & Vision article. The impulse response is then converted to a frequency domain information by applying a Fast Fourier Transform.
Polar maps – the Geddes approach
Polar response plots, such as the ones shown above, are a little cumbersome to use for the purpose of reviewing speaker directivity since you end up with one chart per frequency. A better way to look at speaker directivity is the polar map, popularized in recent years by Earl Geddes of GedLee LLC who wrote a detailed white paper on directivity that you may want to read.
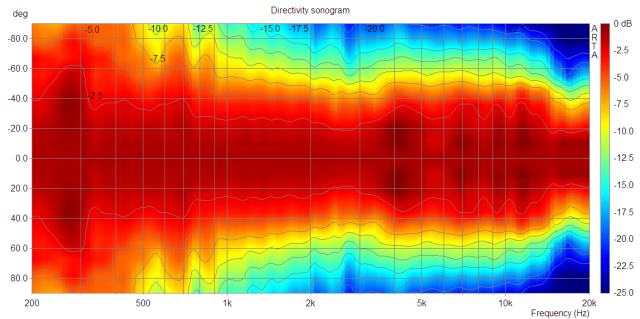
The polar map, or directivity sonogram as the ARTA measurement software calls it, shows the frequency response at different off axis angles. The vertical axis is degrees, with 0 being on axis, the horizontal axis frequency and the data is the amplitude. On occasion these charts are normalized to the on axis frequency response (i.e. the frequency response on axis is subtracted from the individual off axis responses). Only one dimension – either horizontal or vertical can be shown on the chart at one time.
Off axis plots – the SoundStage approach
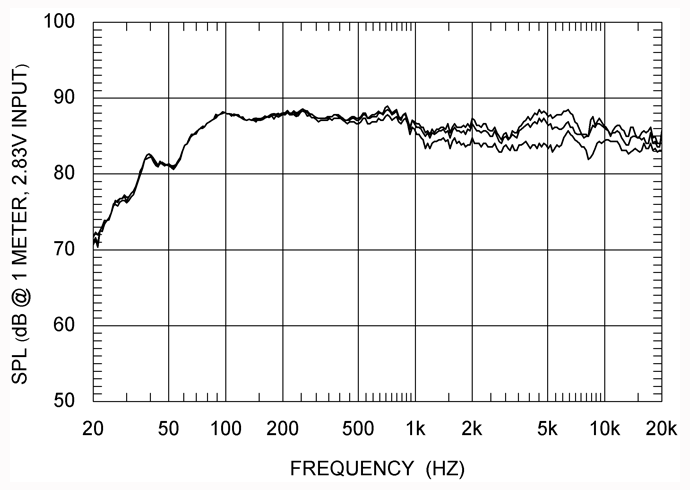
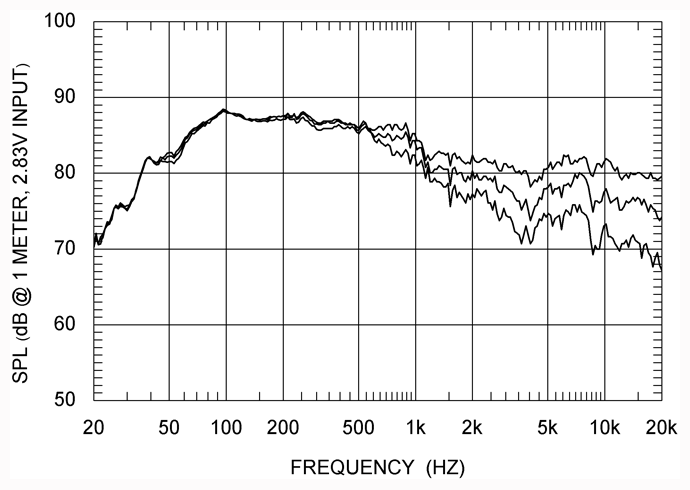
Another way to look at speaker directivity is to use frequency response charts with one plot per angle. SoundStage network uses this approach in their speaker measurements which are conducted in the Canadian National Research Council’s anechoic chamber. SoundStage separates their horizontal off axis measurements into two graphs, probably to improve readability.
Polar response – the Stereophile approach
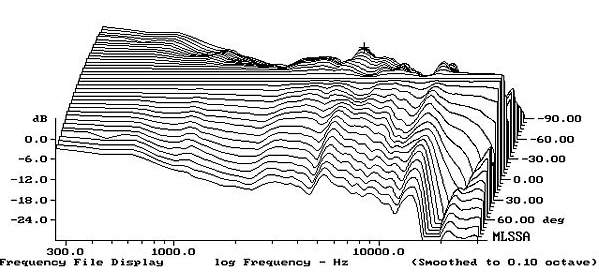
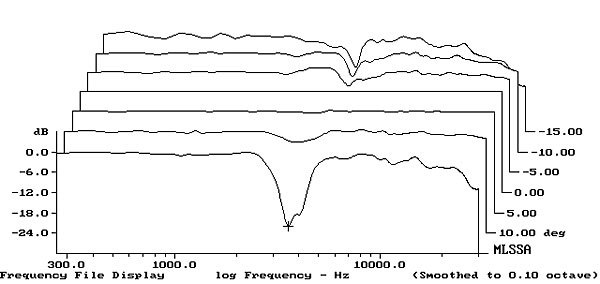
Stereophile use a variation on the polar graph in their loudspeaker reviews. They perform horizontal off axis measurements from -90 to +90 degrees and vertical off axis from -15 to +15 degrees using a 1/10th octave smoothed, windowed FFT approach. The graphs are normalized to the on axis response.
Listening window, early reflections, sound power – the Harman approach
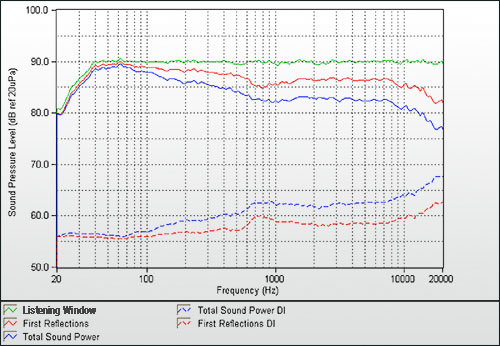
Harman’s are the inventors of this approach that includes multiple plots intended to describe the on axis, early reflection and late reflection contributions of the speaker to what we hear.. They measure speakers at 10 degree resolution in 360 degrees horizontally and vertically around the speaker in an anechoic chamber to generate the following type of chart.
The data in this chart is smoothed at 1/20th octave and has a frequency resolution of 2Hz. In this chart the following measurements are shown:
Listening window = average of on axis, +/-10 degrees vertical and +/-10, 20, 30 horizontal speaker frequency response.
First or early reflections = average of the floor, ceiling, front wall, side wall and rear wall speaker frequency response. The side wall contribution, for example, is the average of +/- 40, 50, 60, 70 and 80 degrees horizontally.
Sound power = the sum of all sounds radiated by the loudspeaker in all directions. The sound power is the speaker’s contribution to late reflected sounds in a room.
Directivity Index (DI) = the difference between the on axis curve and the sound power or first reflections curves
Are there any ways of off axis measurement that I have missed? Please let me know via the comments section below!
By Nyal Mellor © – ACOUSTIC FRONTIERS
