ABOUT MEASUREMENTS BY TROELS GRAVESEN!
“Everything that can be counted does not necessarily count; everything that counts cannot necessarily be counted“. Albert Einstein.
A few comments on MEASUREMENTS before you start interpreting all the readings below.
First of all, if we think measurements will tell us how a speaker sounds, we’re wrong. The perception of sound is way too subjective to be reflected in any measurements we can perform. A loudspeaker system is meant to give us a satisfying idea of an acoustic event and for some people a pair of 5 USD ear-plugs are enough, others spend 200 kUSD on a truly full-range pair of speakers – and the latter may not be happier than the former.
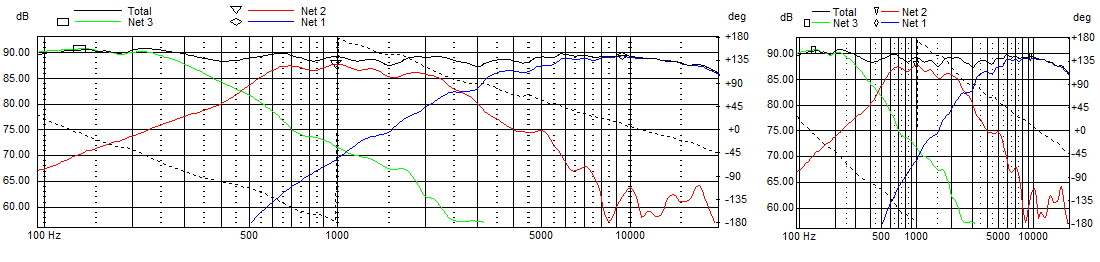
Above you see the same graph presented with the same 50 dB scaling, but at different width and height. Now, we may think the graph to the right looks rather rugged, but if we stretch out the presentation (left) it suddenly looks rather smooth. The left presentation is often used by driver manufacturers to make their frequency response graphs look better. If we apply e.g. 1/6 or 1/3 octave smoothing things look even better. Just this to display how easily measurements can be manipulated to look nice.
Measurements may give us an idea of tonal balance of a system, i.e. too much or too little energy in certain areas. Measurements may tell us about bass extension if far-field measurements are merged with near-field measurements. In addition to this, ports may contribute to bass extension. Most of us diy’ers do not have access to an anechoic room for full-range measurements from 20-20000 Hz, nor do manufacturers for that matter.
What cannot be seen is what kind of bass performance we get in a given room. Bass performance is highly dependent on in-room placement of your speaker and the same speaker can be boomy in one place and lean in another.
Actual SPL level at 1 meter distance and 2.8V input is useful for en estimate of system sensitivity and combined with the impedance profile may give an idea of how powerful an amplifier is needed to drive the speaker to adequate levels.
What measurements do not tell is the very sound of the speaker unless displaying serious linear distortion. The level of transparency, the ability to resolve micro-details, the “speed” of the bass, etc., cannot be derived from these data. Distortion measurements rarely tell much unless seriously bad, and most modern drivers display low distortion within their specified operating range.
Many people put way too much into these graphs and my comments here are only meant as warning against over-interpretation. There are more to good sound than what can be extracted from a few graphs. Every graph needs interpretation in terms of what it means sonically and how it impacts our choice of mating drivers, cabinet and crossover design.
What measurements certainly do not tell is the sonic signature of the drivers, because cones made from polyprop, alu, Kevlar, paper, glass fiber, carbon fiber, magnesium, ceramics or even diamonds all have their way of colouring the sound. Nor do measurements tell what impact the quality of the crossover components add to the sound, from state of the art components to the cheapest of coils and caps, they all measure the same if values are correct.
The choice of crossover topology has a huge impact on the sound we get. We may produce the same frequency response from 1st, 2nd or 4th order filters and they may be Butterworth, Linkwitz-Riley, Bessel and others and they all sound different, very different indeed, so take care!
© Troels Gravesen: http://www.troelsgravesen.dk